The Great Reset means different things to different people. Kerby Anderson provides an overview and a biblical perspective.
Is the idea of “The Great Reset” merely a conspiracy theory? That seems unlikely, given the fact that if you type in those three words in a search engine you will find more than 900 million hits. But the phrase “great reset” apparently means different things to different people, so getting a clear definition is important.

In 2020, the founder of the World Economic Forum co-authored and published a book called COVID-19: The Great Reset.{1} This organization is composed of political, economic, and cultural elites who meet regularly in Davos, Switzerland. The two authors of this book see the current situation in the world as a means of dealing with the “weaknesses of capitalism” supposedly exposed during the pandemic.
But to understand the history of “The Great Reset” you need to go back to the beginning of the World Economic Forum. Klaus Schwab introduced the idea of “stakeholder capitalism.”{2} This is a term sometimes used by progressives to reset the management goals in corporations from shareholders to stakeholders.
The actual term “Great Reset” can be found in a book by that title written by urban studies scholar Richard Florida.{3} He argued that the 2008 economic crash was the latest in a series of great resets that included the Great Depression of the 1930s. A few years later, the book and its ideas became the basis for wanting to “push the reset button” on the world economies.
As you might expect, the pandemic and lockdowns have provided a context in which a reset could take place. The goal would be to make the world greener, more digital, and fairer. Given what the world has been through these last few years, the proponents hope to change the economies of nations, so that they benefit not only shareholders but employees, consumers, communities, and the environment.
Some of the comments proponents have made about “The Great Reset” have become fodder for various conspiracy theories. But it is probably fair to say that the phrase “The Great Reset” means different things to different people. Environmental groups want to reset how we use resources and focus on sustainability. Business leaders want banks and corporations to use an ESG index (environmental, social, and governance index). Globalists want to reset the economy and move us toward a different view of capitalism.
Critics talk about some of the other factors associated with “The Great Reset.” That would include such things as the promotion of uncontrolled immigration along with significant money printing that results in such problems as open borders and uncontrolled inflation.
In this article we look at this important issue from an economic, political, and biblical perspective. As you will see, Christians need to pay attention to this issue in the news.
The Great Reset of Capitalism
The primary focus from the World Economic Forum has been on the attempt to move our current economic system into “stakeholder capitalism.” Some critics have renamed it “corporate socialism” or even “communist capitalism.”
The plan is to change the behavior of corporations to no longer benefit shareholders but to focus on stakeholders. This would be done by requiring businesses and corporations to take a more central role when a crisis, like the recent pandemic, adversely affects society.
Climate change is another “crisis” that corporations need to address. Put simply, corporations need to be involved in social justice issues. That is why we are seeing major corporations getting more involved in political issues and expressing their opinions on issues ranging from transgenderism to voter integrity laws. One effective tactic being used is to rate businesses and corporations with an ESG index (environmental, social, and governance index).
The ESG index can be used to force businesses to comply with a woke agenda or else be squeezed out of the market. Some have suggested that the ESG index is essentially a social credit score being applied to businesses and corporations.
Andy Kessler, writing in the Wall Street Journal, argues that ESG is a loser and that you pay higher expenses for a fund with similar stocks but worse performance.{4} In fact, he encourages investors to buy stocks of companies with great prospects over the next decade at reasonable prices.
Aren’t the companies and countries with a high ESG score better investments? A professor at the University of Colorado evaluated the system in the Harvard Business Review and made four key points about ESG.{5}
First, ESG funds have underperformed. Second, companies that tout their ESG credentials have worse compliance records for labor and environmental rules. Third, ESG scores of companies that signed the UN Principles of Investment, didn’t improve after they signed, and their financial returns were lower for those who signed. His final point was even more significant. He concluded that often companies publicly embrace ESG as a cover for poor business performance. In other words, when earnings are bad, the company cites its ESG score.
Klaus Schwab believes that companies should try and optimize for more than short-term profits and focus on achieving the goals set forth by the UN for sustainable development. That may sound like a good idea until you look at the economic data behind it.
Why Now?
Why has there been such a push for significant changes in this decade? Activists wanting to make changes in society and our economy see the pandemic and governmental response as a political opportunity. It is the familiar phrase, “Never let a crisis go to waste.”
Most social and political change occurs gradually. The crisis of the pandemic forced big government and big pharma to move at a much faster rate. Public acceptance of larger governmental control became a paradigm shift that allowed political leaders and even corporate leaders to move faster than the incremental pace of the past. The pandemic threw open the window for change. The only question is how much of “The Great Reset” will be put in place before it closes.
The pandemic is the external reason for pushing “The Great Reset” but there is also an internal reason. An entire generation of college students learning woke ideology in the universities are now filling positions in various companies. Many commentators naively suggested that once coddled college students enter the “real world,” they will drop their woke ideas and face the reality of making a living in the business world and the free market.
Instead, those woke students brought their ideas into corporate boardrooms and embraced attempts to reset capitalism and corporations. Their professors taught them that capitalism is evil, and that America is riven with racism, sexism, homophobia, and xenophobia. It is time, they believe, to join arms with activists and reformers and bring about “The Great Reset.” We might add that the American consumer hasn’t been so accepting of these ideas, which is why we sometimes hear the phrase “go woke, go broke.”
The push for a “Great Reset” is also taking place during what many commentators refer to as the fourth industrial revolution. The first industrial revolution was a mechanical revolution. The second and third revolutions were electrical and digital revolutions. This fourth industrial revolution brings together diverse technologies like artificial intelligence, robotics, nanotechnology, and biotechnology. It also includes philosophical ideas like transhumanism.
In previous programs, I have discussed the impact of surveillance on our privacy. We warned about the influence of Big Tech and Big Data. And we have also talked about the merging of humans and machines. Each new technological development brings progress and benefits, but they also bring legitimate concerns about how these technologies can be abused in the wrong hands.
How then will this be accomplished?
Administrative State
It may be difficult to imagine how the great reset programs could be implemented in the US. Only a few members of Congress would support these ideas. As we have discussed above, many of these ideas have been implemented in woke corporations. But these programs could also be implemented by the administrative state or what some have called “the deep state.”
Two books document the deep state. Michael Glennon (Tufts University law professor) wrote about National Security and Double Government.{6} This dual-state system, he explained, began under President Bush but was continued under President Obama.
Mike Lofgren (former congressional aide) wrote about The Deep State: The Fall of the Constitution and the Rise of a Shadow Government.{7} He argued that there is “the visible government situated around the Mall in Washington, and then there is another, more shadowy, more indefinable government that is not explained in Civics 101 or observable to tourists at the White House or the Capitol.” He explained that it wasn’t a “secret, conspiratorial cabal” but rather “the state within a state is hiding mostly in plain sight.”
The reason we have an executive bureaucracy is to benefit from the research and experience of public servants who have devoted their lives to understanding the social and political implications of federal policies. This has always been a necessary function, but especially with the last few presidents. The experts in the bureaucracy can provide context and prevent presidents and their cabinets from making huge mistakes.
But there is another side to the federal bureaucracy. We may suppose that bureaucrats are there to implement the policies of the President and administration. Political appointees to the cabinet always say that they “serve at the pleasure of the president.”
That may be true for them. But a career civil servant has a different perspective and expects to be in government much longer than the four or eight years a president holds office. We may think of the bureaucracy as like a military unit (where every order is routinely obeyed). But the bureaucracy is often more like a university faculty (where you are part of a team but also have many of your own ideas about what should be done). Often the federal bureaucracy slows down the implementation of the president’s policies or even chooses to ignore them.
As I discussed in a previous program on The Liberal Mind, even with the best of bureaucrats, the “road to serfdom” can be paved with good intentions. Fredrick Hayek wrote his book with that title because he was concerned that most government officials and bureaucrats write laws, rules, and regulations with good intention. They desire to make the world a better place and may believe that the best way to achieve that is to implement many of the great reset policies. That is why we need to pay attention to the “deep state” and administration policies.
Biblical Perspective
What is a biblical perspective on the great reset? It would be easy to merely link all these ideas to end-time prophecy. It is easy to see how these emerging technologies and the concept of the “great reset” could be used by the Antichrist (2 Thessalonians 2, Revelation 13). Computer technology and enhanced surveillance would allow this future leader to control the world. But it is important to consider how we should respond in our current world to these proposals.
We are seeing many examples of leftist authoritarianism today and need to be alert and involved. James 4:7 says we have a responsibility to resist evil, and Paul tells us to fight the good fight (2 Timothy 4:7). Jesus teaches that we are to be the salt of the earth and the light of the world (Matthew 5:13-16).
Christians can agree with the goals of addressing economic inequality and the need to care for the environment. We are to defend the poor and oppressed (Psalm 82:3) and to be good stewards of God’s creation (Genesis 1:27-28). But we should also be concerned about the authoritarian impulses we see not only in government but in major corporations.
First, we should separate the message from the messenger. The World Economic Forum and its participants are sometimes naïve and they even propose disturbing solutions to very real problems in our society. We can agree with their attempts to deal with poverty and economic inequality, but we must reject some of the ways in which they want to reset the world and bring about change.
Second, we should apply the Bible and a biblical worldview to each issue. For example, a biblical view of justice usually differs from many of the secular, progressive ways of working for justice that also includes such things as the promotion of sexual and gender identities.
Third, we should apply a biblical perspective to technology. The Bible does not condemn technology but often reminds us that tools and technology can be used for both good and evil. The technology that built the ark (Genesis 6) also was later used to construct the Tower of Babel (Genesis 11). A wise and discerning Christian should evaluate the benefits and drawbacks of each technology.
Christians will need discernment (Proverbs 18:15) in judging the ideas associated with the “great reset.” The phrase can mean different things to different people. Many of the ideas associated with it are bad for our country and us. But we can join hands with those who desire to make a better world and want to do it in ways that don’t contradict the Bible.
Additional Resources
Kerby Anderson, A Biblical View on The Great Reset, Point of View booklet, 2022.
Marc Morano, The Great Reset: Global Elites and the Permanent Lockdown, Washington, DC: Regnery, 2022.
Vivek Ramaswamy, Woke, Inc. New York: Center Street, 2021.
Michael Rectenwald, “What is the Great Reset?” Imprimis, December 2021.
Notes
1. Klaus Schwab and Thierry Malleret, COVID-19: The Great Reset, Agentur Schweiz, 2020.
2. Klaus Schwab, Stakeholder Capitalism: A Global Economy that Works for Progress, People and Planet, NY: Wiley, 2021.
3. Richard Florida, The Great Reset: How the Post-Crash Economy Will Change the Way We Live and Work, NY: Harper Business, 2011.
4. www.wsj.com/articles/esg-loser-funds-costs-basis-points-blackrock-500-environment-green-sec-11657461127
5. hbr.org/2022/03/an-inconvenient-truth-about-esg-investing
6. Michael Glennon, National Security and Double Government. Oxford University Press, 2016.
7. Mike Lofgren, The Deep State: The Fall of the Constitution and the Rise of a Shadow Government, NY: Penguin Books, 2016.
©2023 Probe Ministries

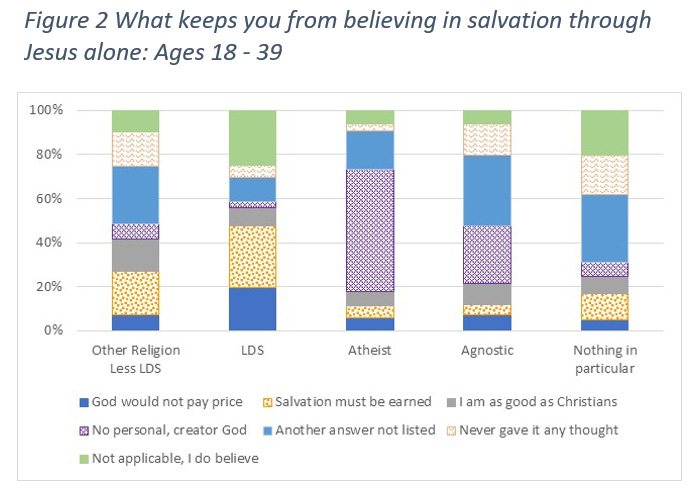 To get a better understanding of what drives these results, we dove further into the makeup of each of these two groups. The results are shown in Figure 2.
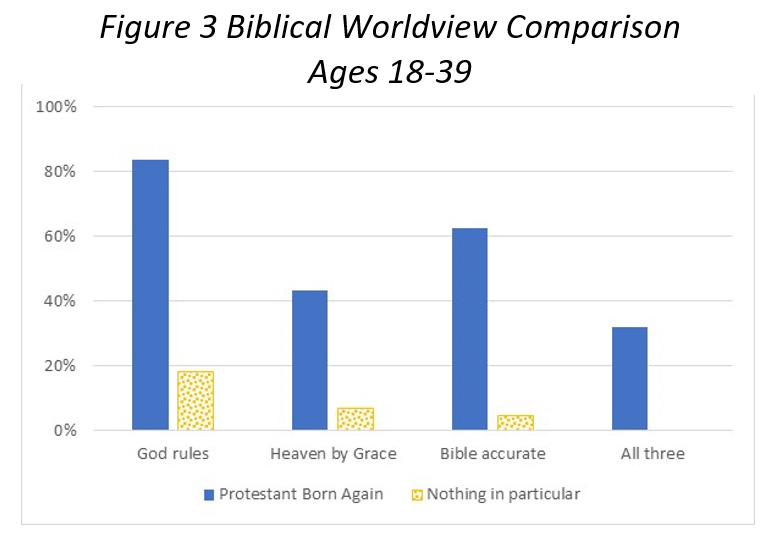 Let’s compare the results for Born-again Protestants and those who claimed to be Nothing in Particular. As shown in Figure 3, for each of the questions those agreeing with a biblical worldview among the Nothing in Particulars is a small fraction of those among Born-again Protestants. When we combine the three questions together, we see one out of three Born-again Protestants vs. no NIPs. Certainly, some of these NIPs came from an evangelical background, but none of them interviewed in our survey ascribe to a basic evangelical worldview as adults. As noted in our first report, one in three orn-again Protestants is a disappointing percentage ascribing to these biblical worldview questions, but it is certainly dramatically better than the Nothing in Particular group.
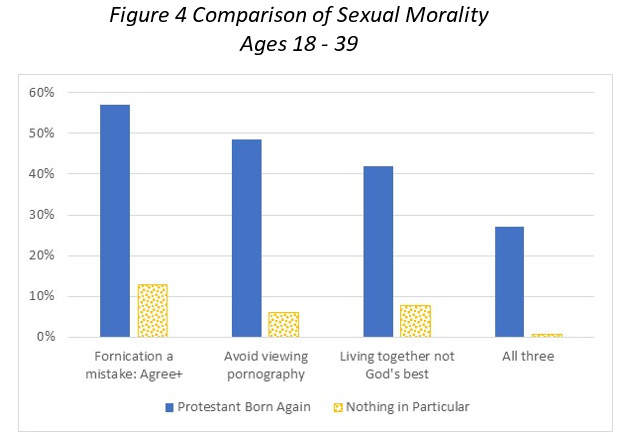 The results from our survey are shown in Figure 4. Once again, we see a large difference between these two groups. Clearly, the NIPs do not ascribe to a biblical view on sexual morality. The majority of Born-again Protestants do not ascribe to those beliefs either, but a significant minority of them do.